A cleaner
cold chain
Data
Models
Monitor
A safer
glass of milk

Milkkeeps itsownclock.

An open monitor for the cold chain of milk. It reads a temperature log and says how likely it is that the milk has crossed its bacterial limit, and how sure it can be.

Explore the
journey
240,000 simulated deliveries373 ComBase records27 automated testsPython · C · JS
Why we started

It began as a box. It became a question.

For the Smart India Hackathon our team designed a cold-chain pod for dairy logistics: an ESP32, a DS18B20 temperature probe and a Peltier cooler, with an app that warns when milk has been too warm for too long. Building its shelf-life model raised a question the hardware could not answer.

N(t) = N₀ eμt
01The pod

A logger watches

The probe records the temperature of the pack every few minutes, faithfully and cheaply.

02The gap

Bacteria hide

How many bacteria the milk started with, which kind, how fast they wake up: no thermometer can see any of it.

03The question

How much can a log tell?

When a monitor is wrong, is it the cheap sensor, the reading interval, the formula, or the hidden biology? We set out to measure each.

What we built

DairyGuard Kinetic, end to end.

A complete, open system: real growth data, kinetic models, a monitor that turns a log into a verdict, a simulator that tests it, and three ways to run it.

√μ = b (T − Tmin)
01 · DATAGrowth records373 milk records from ComBase, published experiments, every parameter with its source.data/
02 · MODELSKineticsSquare-root growth law, Gompertz shelf life, Baranyi reference, four rival laws and a neural law.dairyguard.kinetics · growthlaws
03 · ESTIMATORThe monitorShelf life used, chance the limit was crossed, hours left at 4 °C, and a plain verdict.dairyguard.monitor
04 · EVALUATIONVirtual cold chain240,000 trips where the truth is known; AUC, paired bootstrap, calibration.dairyguard.benchmark
05 · DEPLOYMENTRuns anywherePython package and command line, C firmware for an ESP32, and a browser app.cli · firmware/ · demo/
$ pip install -e . && dairyguard assess examples/truck_fridge_failed.csv
DairyGuard Kinetic 2026.10  |  Pasteurised milk, psychrotrophic spoilage flora (literature parameters)
Log: 288 readings over 72.0 h, max 26.0 C, 5.0 h above 8 C in 1 warm event(s)

  Shelf life used (textbook batch)     127 %   [########################]
  Chance it crossed the limit           81 %   [###################.....]
  Hours left if held at 4 C              0 h   (typical batch)
  Hours left, cautious                   0 h   (9 batches in 10 reach this)

  Verdict: LIKELY OVER THE LIMIT
  Limit: FSSAI aerobic plate count limit for pasteurised milk, 3 x 10^4 CFU/mL
Firmware · tested against PythonOn a low-cost chip

A C core keeps 64 plausible batches in under 2 kB on an ESP32, drives a green, amber or red light, and matches the Python monitor at every reading.

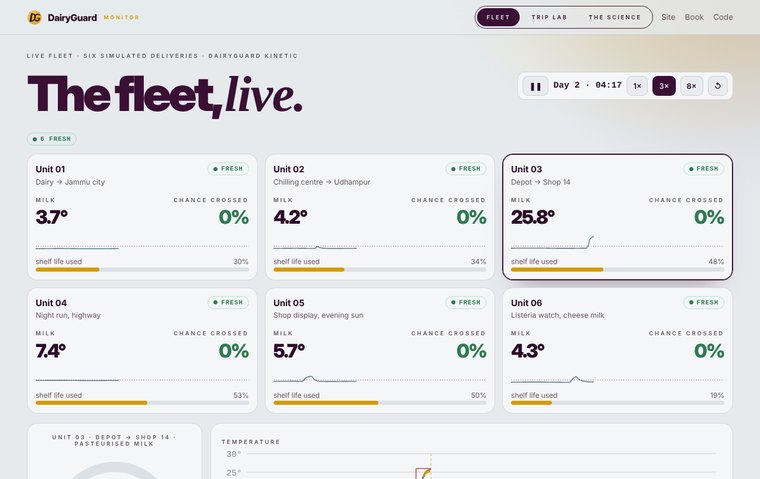
Browser appWatch a fleet live

Six deliveries judged in real time, a trip you can draw with your finger, and the science behind every verdict.
How we did it

From records to results.

01

Collected the data

Searched ComBase, the public database of bacterial growth experiments, for milk. Transcribed organism, temperature, pH, water activity, source study and growth rate for each record, and converted every rate from log₁₀ to natural-log units. Added a published fluctuating-temperature experiment (Lin et al. 2016) and the FSSAI limit.

373 records52 sourcesevery value sourced or flagged
02

Fitted and trained the models

Fitted five temperature laws by least squares on log growth rates, including a monotone neural network trained as an ensemble of five. Judged every law on data it had not seen: each Listeria study left out in turn.

5 laws20 studies held outneural ensemble × 5
03

Built a world where the truth is known

Simulated deliveries minute by minute: fridges, warm spells, packaging, three thermometers, four reading intervals, and hidden biology drawn for every trip. The reference model decides the truth; the monitor sees only the log.

240,000 trips5 worlds × 12 settingsfixed seeds
04

Tested it hard

Scored every rule by AUC, compared rules on identical trips with a paired bootstrap, checked calibration, pitted the monitor against a model trained on 4,000 labelled trips, and reran everything to confirm identical results.

27 automated testsexact rerun
05

Proved why it works

Showed that bacterial growth depends on a temperature history only through one running total, a biological clock, the same idea as Ozawa's generalized time in thermal analysis. It predicts every number in the loss budget.

exact proof
06

Shipped it

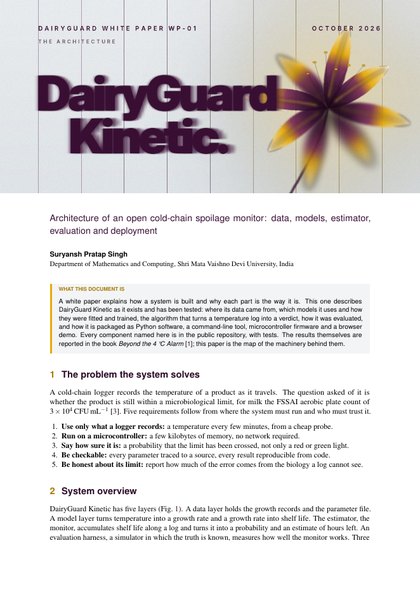
Packaged the monitor as a Python library and command-line tool, wrote it again in C for microcontrollers, and built the browser app. Wrote it all up in a book and an architecture white paper.

PythonCJavaScript
What we found

The thermometer isn't the problem. The hidden biology is.

We scored every way of reading a log on one question: can it tell the cartons that crossed the bacterial limit from those that didn't? A coin flip scores 50, a perfect method 100.

AUC = P(s⁺ > s⁻)
Lost because no one can see the bacteria simulation27–40 pts
Spread of growth rates between real studies real data25%
Won back by one heat test of the milk simulation69–94% of the gap
Gained by a lab-grade thermometer simulation≤ 2 pts
Lost by reading hourly, not every minute simulationabout 0
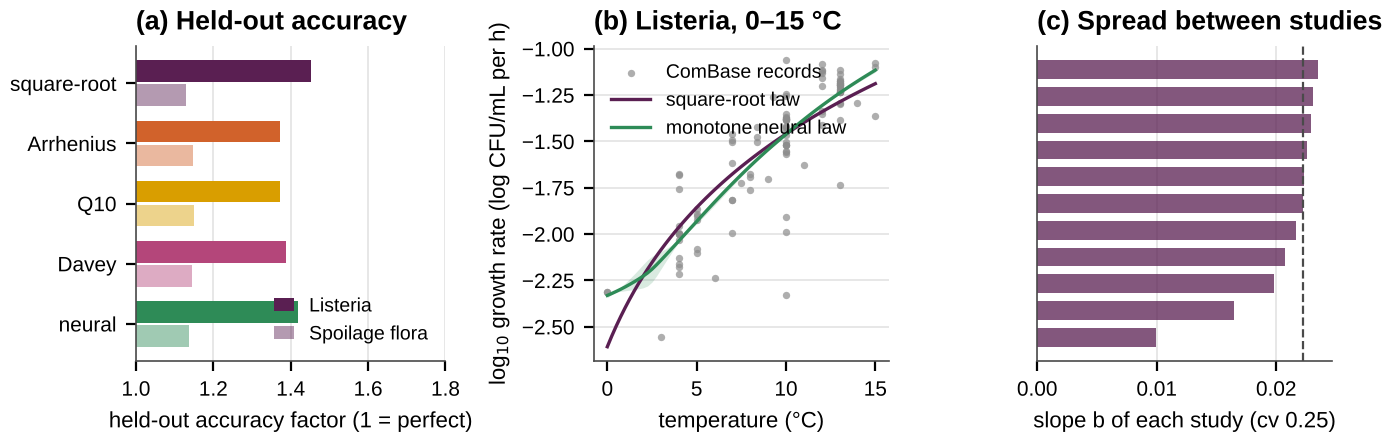
Held-out accuracy of five growth laws, Listeria growth rates with the square-root and neural laws, and the slope of each study

Real data. On studies they never saw, five laws including a neural network score within a narrow band; growth rates differ between studies by about 25%.

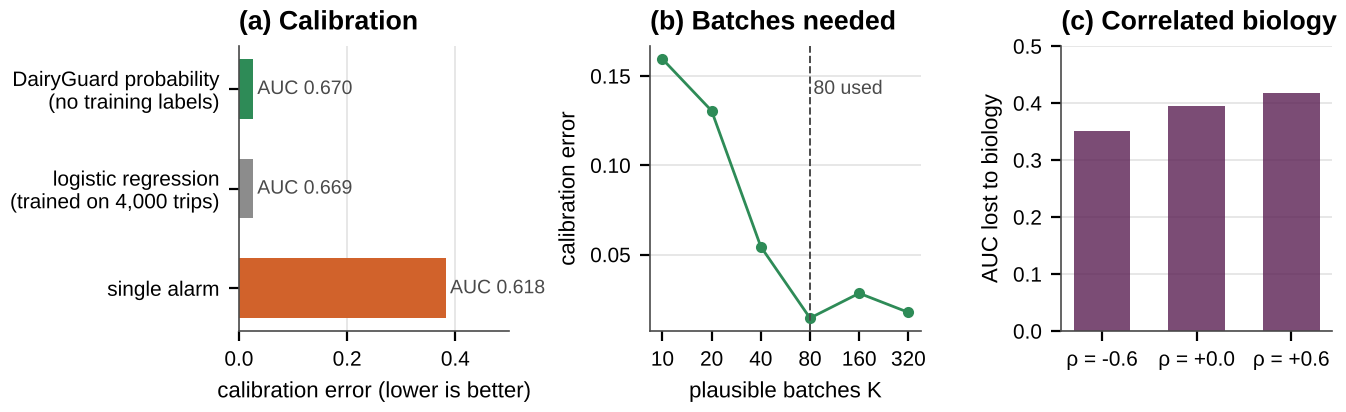
Calibration against a trained model, Monte Carlo convergence, and correlated biology

The monitor under test. As well calibrated as a model trained on 4,000 labelled trips, stable from 80 plausible batches, and robust to correlated biology.

"Crossing the limit" means the bacteria count passed the FSSAI hygiene limit for pasteurised milk. It is a count, not a taste test or a safety verdict. The heat test is a calorimetry measurement, simulated so far.

The key idea

Bacteria keep their own clock.

τ = ∫ μ(T) dt

Milk at 4, 8 and 12 °C crosses the limit at very different times. Switch to the bacteria's own clock, which runs faster when it's warm, and the three curves become one.

That one running total is all a monitor needs from the log, which is why a cheap thermometer and hourly readings are enough, and why the biology is what's left.

dy/dτ = q/(1+q) · (1 − ey−ymax)
Where it stops

The evidence points to the batch.

zb ∼ 𝒩(m, Σ)
25%

Real growth rates differ between studies by a quarter. The biology a log can't see is real, and large.

No gain

A flexible neural law learns nothing new from growth rates alone. Better formulas aren't the answer.

±16 h

The monitor's estimate of hours left is cautious but imprecise, because the batch is unknown.

Next in our labDesign · prototype on simulated data

DairyGuard Batch: a model that learns each batch

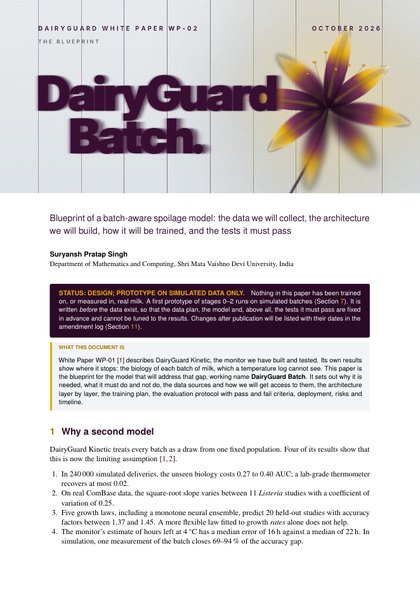
Keeping DairyGuard Kinetic's proven core, the next model will learn each batch's biology from complete growth curves of milk under changing temperatures and simple tests at loading. Its blueprint is published before any lab data exist: the data we will collect, the architecture, the training plan, and the pass-or-fail tests it must meet. A first prototype already runs on simulated batches.

1 · Clock2 · Population of batches3 · Batch encoder4 · Closed-form core5 · Shift residual, if needed
First page of White Paper WP-02
October 2026Done

DairyGuard Kinetic

Package, command line, firmware and browser app; the book; the architecture white paper; the blueprint of the next model.

October 2026Done

Real-data checks

Five laws tested on 20 unseen Listeria studies; between-study spread measured; monitor against a trained model.

Nov – Dec 2026Now

Curves and protocol

A pipeline for complete ComBase growth curves, and a lab protocol for milk under changing temperatures.

Jan – Feb 2027Next

First lab measurements

Plate counts of milk at steady and shifting temperatures, with simple batch tests on day one.

After thatPlanned

Peer review

A journal paper, built on the lab results, once they stand.

Why it matters · 10

आहारशुद्धौसत्त्वशुद्धिः

āhāra-śuddhau sattva-śuddhiḥ

When food is pure, the mind is pure.

Chāndogya Upaniṣad 7.26.2